Statistical analysis of Topic Maps in R
R may be used to compute graph statistics related to Topic Maps or other groups of topics in Wandora. The selected group of topics is represented in R as an igraph. The igraph library is thus a prerequisite for graph analysis of Topic Maps in R. Several use cases are presented below. Refer to the igraph documentation for further methods of statistical graph analysis.
Contents |
Handling topics in R
The R interface is exposed through the R console found in the toolbar in Wandora. Scripts may also be run using the R topic panel in view -> Add topic panel -> R.
We may aquire the targeted set of topics from Wandora using methods of classes that have been exposed by the Java-R-bridge. We may for example query for all the visible topics simply by calling getAllTopics() from rinit.r or more specifically
- Retrieve the Wandora Java object using getWandora() from org.wandora.application.Wandora
- Retrieve the topics themselves using Java mehtod calls and unwrap the returned iterator to a list suitable for futher use.
wandora <- J("org.wandora.application.Wandora")$getWandora()
tm <- wandora$getTopicMap()
ts <- unwrapIterator(getTopicMap()$getTopics())
An igraph object is next created with makeGraphJava where the helper class org.wandora.application.tools.r.RHelper is utilized for heavy lifting. A similar but slower function using R is implemented in makeGraph. The resulting object is next used for the actual statistical analysis.
Example #1: Calculate the graph diameter
We may now use R to replicate the functionality of the Topic Map diameter calculator provided in Wandora. In comparison this process should prove to be faster, less memory consuming and therefore more suitable for large datasets.
g <- makeGraphJava(ts)
d <- diameter(g)
A full example is written out in GetDiameter.r found among other examples in build/resources/r.
Further statistics
Having constructed the graph there are a multitude of statistics we may compute using functions provided in igraph. In addition to the diameter calculation introduced above a few basic ones are listed here.
- Eigenvector centrality and betweenness centrality using
evcent(g)andbetweenness(g) - Degree distribution via
degree.distribution(g)
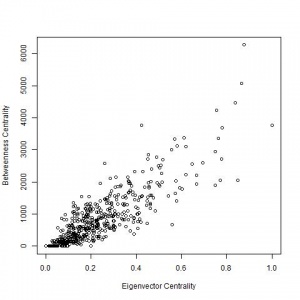
Betweenness centrality plotted against eigenvector centrality for a random generated graph with 500 topics and 1000 associations.
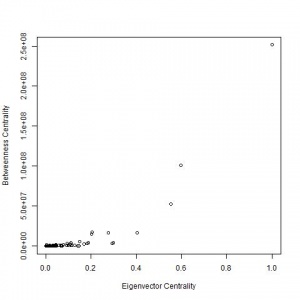
Betweenness centrality plotted against eigenvector centrality for the The Service Map - Helsinki region public services


Mapping vertices to topics
makeGraphJava(topics) transforms the Topic Map representation to a rudimentary undirected graph where topics are represented as vertices identified by a running index. Associations are in turn represented as a set of edges pairing the vertexes together. It is difficult to target a specific topic by it's SI or other identifier in Wandora since all topic data excluding associations is lost in the transformation.
In order to preserve the mapping between topics and respective vertices we may construct the map by hand and use it to call makeGraph(topics, indiceMap) in rinit.r. More specifically
- Fetch all the topics we want in the graph. Here we fetch all topics contained in the Topic Map.
- Construct the indice map where each subject identifier string maps to an index in the graph.
- Get the string representation of a subject identifier of each topic. This is equivalent to t.getOneSubjectIdentifier( ).toString();
- Append the si-index pair to the map. Indices range from 1 to
length(ts). - Call makeGraph with indices specified in order to make sure our indices are used to construct the graph.
 ts <- getAllTopics()
 ind <- list()
 for(t in ts){
   si <- .jcall(t,"Lorg/wandora/topicmap/Locator;","getOneSubjectIdentifier")
   si <- .jcall(si,"Ljava/lang/String;","toString")
   ind[[si]] <- length(ind)+1
 }
 g <- makeGraph(ts,ind)
We may now select a topic in Wandora and import it to R with getContextTopics(). A detailed example is detailed below.
- Get the selected topics from Wandora.
- Get the string representation of the SI and using it look up the index from the map constructed earlier.
 cts <- getContextTopics()
 for (ct in cts){
   si <- .jcall(ct, "Lorg/wandora/topicmap/Locator;","getOneSubjectIdentifier")
   si <- .jcall(si, "Ljava/lang/String;","toString")
   cind[[length(cind)+1]] <- ind[[si]]
 }
Having found the indices of vertices for the selected topics we can now compute statistics related to those vertices in the graph. For example we may compute the immediate neighborhood sizes of those topics with neighborhood.size(g,1,cind).
A full example is again written out in GetContextTopicsNeighbours.r in build/resources/r. We may also define a reverse lookup for SIs in the following manner:
 getSI <- function(i){
   for(t in ts){
     si <- .jcall(t,"Lorg/wandora/topicmap/Locator;","getOneSubjectIdentifier")
     si <- .jcall(si,"Ljava/lang/String;","toString")
     if(ind[[si]] == i)
       return(si)
     }
   }
   return("")
 }
Example #2: Find the topics in a community
This lookup may be utilized in finding topics for a subset of vertices from the graph. In this case we first compute communities for a set of topics. We then pick a community and find the topics in it.
Again, fetch all topics in Wandora.
ts <- getAllTopics()
Construct the vertex index to topic SI mapping discussed above.
 ind <- list()
 for(t in ts){
   si <- .jcall(t,"Lorg/wandora/topicmap/Locator;","getOneSubjectIdentifier")
   si <- .jcall(si,"Ljava/lang/String;","toString")
   ind[[si]] <- length(ind)+1
 }
 g <- makeGraph(ts,ind)
Get the communities of the graph g. Here we use random walk to distinguish communities.
ns <- walktrap.community(g)
Get all the vertex IDs in the community with the ID 10
 bigComVer <- list()
 mem <- membership(ns)
 for(m in mem){
   if(mem[[m]] == 10){
     bigComVer[[length(bigComVer)]] <- m
   }
 }
Finally find the SIs for the vertices we found above.
sis <- lapply(bigComVer,getSI)
This approach may also be used with the diameter calculations to find the vertices of the longest path in the topic. We find the vertice IDs with
d <- get.diameter(g)
and find the corresponding SIs with
sis <- lapply(d,getSI)
Importing graphs from R to Wandora
Above we've used the rJava bridge to import topics from Wandora to R. We may also import graphs from R to Wandora as topics and associations. Auxiliary data may be specified to use as base names and occurrence data for the extracted topics.
Example #3: the bull graph
As a simple example we use igraph to generate a bull graph which we will import to Wandora. First we create the graph.
g <- graph.famous("bull");
Next we attach a name the vertices of the graph. The order in the list corresponds to the vertex IDs in the graph. We could as well use the actual names specified in the graph if the vertices are already named.
names <- c("first","second","third","fourth","fifth")
Now we can call createTopics in rinit.r with
createTopics(g,baseNames=names)
We may further add to the created topics by specifying an array of occurrence data in the form
| Occ. type / Vertex ID | 1 | 2 | 3 | 4 | ... |
| Occurrence type 1 | value 1 | value 2 | value 3 | value 4 | ... |
| Occurrence type 2 | value 1 | value 2 | value 3 | value 4 | ... |
| ... | ... | ... | ... | ... | ... |
As a trivial example we may add the base names as occurrences of type foo with
 occ<-list()
 occ[["foo"]]<-names
 createTopics(g,baseNames=names,occurrences=occ)

A vertex of a graph imported into Wandora: the name 'second' is set as a base name as well as an occurrence of type foo

The imported graph is here visualized with the D3 graph visualization